How To Talk About Performance - Part 2
In part 1 of this post, we talked about how to report on performance - The important numbers and how to visualize them. Now we must know what we should actually be measuring in our system.
One thing that impressed me on my first day working in the loop in downtown Chicago was how fast the fast food restaurants are able to serve customers. I distinctly remember going to Chipotle and seeing the line snake through the restaurant and thinking “This is ridiculous, I can’t believe I’m going to wait 20 minutes to order Chipotle”. I was in and out in less than 5.
A fast food restaurant is in fact a relatable way to think about two important aspects of application performance: Service Time and Response Time.
Service Time
Service time is the amount of time it takes to process one request in isolation. Imagine that you have a worker who can serve each customer their food in exactly 1 minute each from the time that the customer steps up to the counter to order. Throughout the day, this worker reliably takes orders and serves up the food 1 minute later. This worker is not phased by the lunch time rush and does not get lazy during slow periods. In short, his performance measured independent of customers arriving at the restaurant is constant.
In request/response systems, this is the amount of time that each input spends in active processing. This metric is independent of message rates into the system, which may vary over time.
Response Time
Response time can be thought of as the amount time between when the customer walks in the door to the restaurant and when the customer exits with their food. Not only does this include the time it takes the customer to get their food after they ordered (Service time), but also includes the time that they spend standing in line, waiting for every patron in front of them to order and receive their food.
Response time is dependent on two things: The service time of the system (how long it takes to get your food after ordering), and the rate of inputs to the system (how fast are customers showing up to the restaurant). The relationship is fairly simple: At any period of time where the rate of inputs is higher (interarrival rate lower) than the service time of the system, a queue will build.
This leads to an interesting observation that although response times are what the counterparties to your system actually experience, they are not fully in your control as the system engineer. This really sucks for anyone accountable for the SLA of a system.
Think of this as the “lunch time rush”, where many in the city leaves their offices at roughly the same time to head to fast food restaurants. This increased rate of customers arriving at the restaurant is what causes the increase in response time during lunch, rather than the fast food workers suddenly becoming slower. Likewise, during the other parts of the day when few others are getting lunch, you would be able to walk into the restaurant and walk out 1 minute later, not because the workers were faster than during lunch, but simply because no one else was trying to get food at the same time.
Even if you hire faster workers, but still not faster than the lunch time rush arrival rate, your response time will only marginally improve.
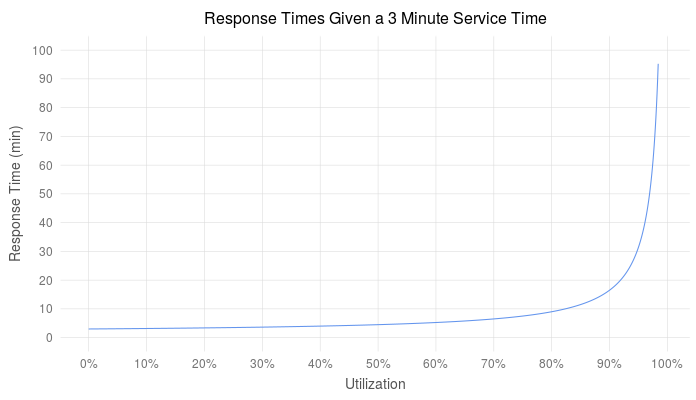
The relationship between response time and service time is central to queuing theory. There are equations which relate utilization (message rates) and service time to show queue length, but the summary is that as utilization increases linearly, queue depth and response time increases exponentially.
What to measure
So now we have two metrics we can choose to report, which should we actually show? Both!
Service time shows the true “performance” of your system, independent of all outside factors. Service time is great for testing performance improvements in environments where you cannot exactly reproduce production messaging characteristics.
Response time, although not totally in your system’s control, is still important because it shows how well your system is holding up to demand. If response times are not meeting SLAs and message rates our outside your control, its time to look at ways of improving service time (or carefully increasing your level of parallelism).
How much weight you put on each of these two numbers depends on the characteristics of your system in its ecosystem. A response time distribution from a system with relatively constant message traffic over time will be a higher quality metric then one from a system which is subject to more variable message rates.
How to get faster
For those who have never eaten at Chipotle, your food is prepared in an assembly line - three or so workers each adding which ever ingredients you specify to your burrito and passing it off to the next worker in the line. Each of the workers cooperate with each other such that if their colleague down the line is getting behind they too will slow down to avoid a backup in the middle of the assembly line. This is known as applying backpressure and forces the queue to build in front of the very first worker, rather than somewhere in the middle.
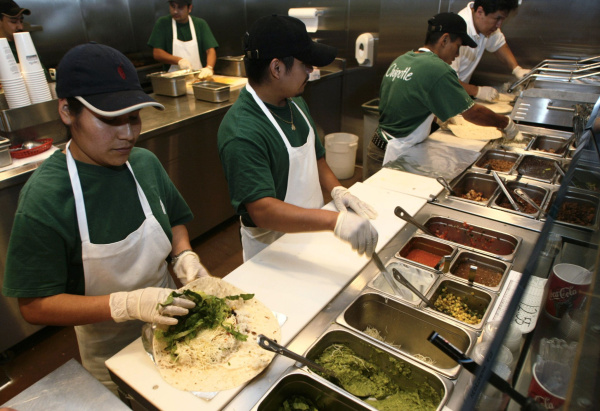
Imagine instead if the workers in the Chipotle assembly line did not apply backpressure, and processed each order as quickly as possible from the time the order was handed to their stage in the assembly line. If a worker down the line is not keeping up, workers ahead of him will stack up the orders for the slower worker to process.
For the sake of this example, assume that the slowest stage in this assembly pipeline is the the last stage: paying for the food (and it likely is with new chip-enabled credit cards). If you were the manager of this Chipotle and wanted to improve response time during the lunch rush. Let’s say you could implement a new burrito assembly line stage which would decrease the food prep time by 20%. Making this change and ignoring the bottleneck of your system - the cashier - will only cause the queue in front of the cashier to grow, and would not help your response time.
Another example that everyone can relate to, although not related to fast food, is doing your laundry. It doesn’t matter if your washer takes 20 minutes or 40 minutes, if your dryer takes 1 hour to run it will still take you 2 hours to do two loads of laundry.
Tying these examples back to technology, you can spend time and money improving things like network performance, cache efficiency, or input parsing, but if the bottleneck of your system is some disk I/O stage, you will only achieve marginal response time improvements. Improving that disk I/O stage by even the smallest amount will have an exponential effect on response time.
Further Reading & Resources
Martin Thompson is a computer science performance expert who has given many talks on this subject. I highly recommend spending some time and watching some of his talks on Youtube. This talk specifically focuses on service and response time.
Gil Tene’s popular talk on “How not to measure latency” talks about some factors which affect response time but would not show up in service time measurements (e.g java garbage collections)
Little’s Law is an excellent place to get started learning about the math behind queuing theory.
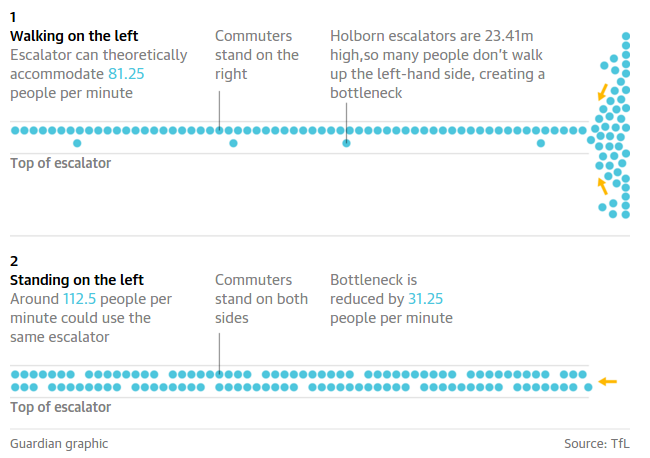
The Guardian recently wrote about how Transport for London recommended encouraging everyone to actually stand on escalators, rather than walking up them as a way to reduce the bottleneck by increasing parallelism.
Response Time Visualization
The example above simulated response times for a M/D/1 queue with a constant 3 minute service time
number_ticks = function(n) {function(limits) pretty(limits,n)};
require(data.table)
getResponseTimes = function(serviceTime, utilization) {
  return((serviceTime*(2-utilization)) / (2*(1-utilization)))
}

times = data.table("Utilization"=seq(0, 0.99, 0.001))
times[,`Response Time`:=getResponseTimes(3, Utilization)]

ggplot(times, aes(x=Utilization, y=`Response Time`))+
  geom_line(color="cornflowerblue")+
  scale_y_continuous(breaks = number_ticks(10), limits=c(0,100))+
  scale_x_continuous(breaks=number_ticks(10),labels=percent)+
  ggtitle("Response Times Given a 3 Minute Service Time")+
  ylab("Response Time (min)")
}
Leave a Comment